How to track vessels with Python, ClickHouse and Grafana
In this article, you'll learn how to track vessels using the AisStream API, Python, ClickHouse, and Grafana to visualize the information.


I like tracking things... airplanes, cars, devices, and even Santa. Today, we are going to learn how to track vessels using Python to collect and process the information, push it into ClickHouse, and create a dashboard to visualize the collected data using Grafana.
Let's get started
I like tracking things... airplanes, cars, devices, and even Santa. Today, we are going to learn how to track vessels using Python to collect and process the information, push it into ClickHouse, and create a dashboard to visualize the collected data using Grafana.

Tracking Choice
I chose to track vessels in two distinct locations: the port of Buenos Aires, Argentina, and the port of San Francisco, United States. These ports were selected due to their high activity levels and my personal experience visiting them.
Let's set up our infrastructure...
As the title of this blog post suggests, we are going to use ClickHouse. If you are not familiar with this database, I can tell you that it is the fastest and most resource-efficient real-time data warehouse and open-source database.
Also, we are going to use Grafana, which we have discussed on this blog several times.
 Eric Leijonmarck
To do this, we are going to run it on our localhost using Docker. My docker-compose file looks like this:
version: '3.8'

services:
  clickhouse:
    image: clickhouse/clickhouse-server:24.5.2.34
    container_name: clickhouse
    ports:
      - "8123:8123"  # HTTP interface
      - "9000:9000"  # Native client interface
    volumes:
      - clickhouse-data:/var/lib/clickhouse
    environment:
      - CLICKHOUSE_USER=nacho
      - CLICKHOUSE_PASSWORD=clickhouseFTW2024!
      - CLICKHOUSE_DEFAULT_ACCESS_MANAGEMENT=1
    restart: unless-stopped

  grafana:
    image: grafana/grafana:latest
    container_name: grafana
    ports:
      - "3000:3000"
    environment:
      - GF_SECURITY_ADMIN_USER=admin
      - GF_SECURITY_ADMIN_PASSWORD=admin
    volumes:
      - grafana-data:/var/lib/grafana
    depends_on:
      - clickhouse
    restart: unless-stopped

volumes:
  clickhouse-data:
  grafana-data:
If you paid attention to this file, you will see a few things here:
- I'm persisting the data of ClickHouse in the
clickhouse-datavolume. This means that if my container is deleted, the data remains. The same applies to Grafana. - I'm specifying environment variables in both containers. In ClickHouse and Grafana, I'm setting a username and password.
- Also, I'm exposing the ports in ClickHouse and Grafana.
Once we have modified this according to our needs, we can run:
docker-compose up -dIf everything goes well, when you run docker ps you will see something like this:
CONTAINER ID   IMAGE                                    COMMAND            CREATED          STATUS          PORTS                                                      NAMES
b25f21e653f4   grafana/grafana:latest                   "/run.sh"          20 minutes ago   Up 20 minutes   0.0.0.0:3000->3000/tcp                                     grafana
f4f5ae585632   clickhouse/clickhouse-server:24.5.2.34   "/entrypoint.sh"   20 minutes ago   Up 20 minutes   0.0.0.0:8123->8123/tcp, 0.0.0.0:9000->9000/tcp, 9009/tcp   clickhouse
Ok, the infrastructure is up and running. Let's create the database in ClickHouse.
Dealing with ClickHouse
Before we start pushing information, we need to create our database. In our code, we can create the table with the information we are going to store. You will see that this is quite an easy process.
We are going to use the famous and great Curl to create the database called vessels_tracking:
curl -u nacho:clickhouseFTW2024! 'http://localhost:8123/' --data-binary "CREATE DATABASE vessels_tracking"
To validate that our database is there, we can run something like this:
curl -u nacho:clickhouseFTW2024! 'http://localhost:8123/' --data-binary "SHOW DATABASESIf everything works as we expect, we should see this:
INFORMATION_SCHEMA
default
information_schema
system
vessels_tracking
Shaping and pushing data
Ok, the fun part. It's time to shape the data and send it to ClickHouse. We are going to use Python and start by installing the ClickHouse client for this language:
pip3 install clickhouse-driverWe also need to install websockets
pip3 install websocketsNow, the code...
import asyncio
import websockets
import json
from datetime import datetime, timezone
from clickhouse_driver import Client
import os

# Connect to ClickHouse
client = Client(host='localhost', user='nacho', password='clickhouseFTW2024!')

# Create database and table
client.execute('CREATE DATABASE IF NOT EXISTS vessels_tracking')

create_table_query = '''
CREATE TABLE IF NOT EXISTS vessels_tracking.ais_data (
    ts DateTime64(3, 'UTC'),
    ship_id UInt32,
    latitude Float32,
    longitude Float32,
    speed Float32,
    heading Float32,
    nav_status String
) ENGINE = MergeTree()
ORDER BY ts;
'''

client.execute(create_table_query)

# Connect to AIS stream and insert data into ClickHouse
async def connect_ais_stream():

    async with websockets.connect("wss://stream.aisstream.io/v0/stream") as websocket:
        subscribe_message = {
            "APIKey": os.environ.get("AISAPIKEY"),  # Required!
            "BoundingBoxes": [
                # Buenos Aires, Argentina
                [[-34.811548, -58.537903], [-34.284453, -57.749634]],
                # San Francisco, USA
                [[36.989391, -123.832397], [38.449287, -121.744995]],
            ],
            "FilterMessageTypes": ["PositionReport"],
        }

        subscribe_message_json = json.dumps(subscribe_message)
        await websocket.send(subscribe_message_json)

        async for message_json in websocket:
            message = json.loads(message_json)
            message_type = message["MessageType"]

            if message_type == "PositionReport":
                # The message parameter contains a key of the message type which contains the message itself
                ais_message = message["Message"]["PositionReport"]
                print(f"[{datetime.now(timezone.utc)}] ShipId: {ais_message['UserID']} Latitude: {ais_message['Latitude']} Longitude: {ais_message['Longitude']} Speed: {ais_message['Sog']} Heading: {ais_message['Cog']} NavStatus: {ais_message['NavigationalStatus']}")
                # Insert data into ClickHouse
                insert_query = '''
                INSERT INTO vessels_tracking.ais_data (ts, ship_id, latitude, longitude, speed, heading, nav_status) VALUES
                '''
                # Ensure nav_status is a string
                values = (
                    datetime.now(timezone.utc),
                    ais_message['UserID'],
                    ais_message['Latitude'],
                    ais_message['Longitude'],
                    ais_message['Sog'],
                    ais_message['Cog'],
                    str(ais_message['NavigationalStatus'])  # Cast to string
                )
                client.execute(insert_query, [values])

if __name__ == "__main__":
    asyncio.run(connect_ais_stream())
Before running this, let's go through important things in this code:
- The connection to the database: make sure it is connected to your instance using the username and password you specified during setup.
- The creation of the database: this is crucial to ensure that the data is there.
- The creation of the table: this is important to ensure that the data we push matches our table.
- The API Key from AisStream: you can sign up using your GitHub account from here.
- The BoundingBoxes: make sure you enter the coordinates according to your needs.
Once we have sorted this out, save this with a name. In my case, it is main.py, and run it:
python3 main.pyIf everything goes well, you will start to see something like this, which means it worked:
[2024-06-13 13:03:59.876760+00:00] ShipId: 368341690 Latitude: 37.794628333333335 Longitude: -122.31805 Speed: 9.1 Heading: 107.5 NavStatus: 0
[2024-06-13 13:04:01.503668+00:00] ShipId: 368231420 Latitude: 37.512494999999994 Longitude: -122.19592666666668 Speed: 0 Heading: 360 NavStatus: 5
[2024-06-13 13:04:02.522329+00:00] ShipId: 366999711 Latitude: 37.810505 Longitude: -122.36067833333333 Speed: 0 Heading: 289 NavStatus: 5
[2024-06-13 13:04:02.994950+00:00] ShipId: 701006099 Latitude: -34.59726166666667 Longitude: -58.36488666666666 Speed: 0 Heading: 85.4 NavStatus: 3
[2024-06-13 13:04:03.902959+00:00] ShipId: 366844270 Latitude: 37.794311666666665 Longitude: -122.28603833333334 Speed: 0.6 Heading: 354.9 NavStatus: 5
[2024-06-13 13:04:04.454044+00:00] ShipId: 256037000 Latitude: 37.39175 Longitude: -123.39798333333333 Speed: 2.1 Heading: 226 NavStatus: 0
[2024-06-13 13:04:05.356680+00:00] ShipId: 368173000 Latitude: 37.774015 Longitude: -122.24171500000001 Speed: 0 Heading: 251 NavStatus: 5
[2024-06-13 13:04:05.449553+00:00] ShipId: 366963980 Latitude: 37.94531166666666 Longitude: -122.50868666666666 Speed: 0 Heading: 293.5 NavStatus: 0
[2024-06-13 13:04:05.963961+00:00] ShipId: 367153070 Latitude: 37.91493333333334 Longitude: -122.36188833333334 Speed: 0 Heading: 289.3 NavStatus: 5
[2024-06-13 13:04:05.990570+00:00] ShipId: 367145450 Latitude: 37.809855 Longitude: -122.41158666666666 Speed: 0 Heading: 34.1 NavStatus: 15
[2024-06-13 13:04:06.297423+00:00] ShipId: 366972000 Latitude: 37.729818333333334 Longitude: -122.52628666666666 Speed: 0.7 Heading: 44.1 NavStatus: 3
[2024-06-13 13:04:06.307300+00:00] ShipId: 367006030 Latitude: 38.092705 Longitude: -122.261055 Speed: 0 Heading: 360 NavStatus: 0
[2024-06-13 13:04:07.014252+00:00] ShipId: 368173000 Latitude: 37.774015 Longitude: -122.24171333333334 Speed: 0 Heading: 251 NavStatus: 5
[2024-06-13 13:04:08.653218+00:00] ShipId: 367469070 Latitude: 37.86828 Longitude: -122.31493999999999 Speed: 0 Heading: 0 NavStatus: 0
[2024-06-13 13:04:09.267404+00:00] ShipId: 368278830 Latitude: 37.792305000000006 Longitude: -122.28416166666666 Speed: 0 Heading: 250.5 NavStatus: 5
[2024-06-13 13:04:09.676525+00:00] ShipId: 367328780 Latitude: 37.80373 Longitude: -122.39635833333334 Speed: 6.3 Heading: 246 NavStatus: 0
[2024-06-13 13:04:09.734593+00:00] ShipId: 367369720 Latitude: 37.905665 Longitude: -122.37193833333335 Speed: 0 Heading: 187.5 NavStatus: 0
[2024-06-13 13:04:09.744267+00:00] ShipId: 367152240 Latitude: 37.806756666666665 Longitude: -122.40414000000001 Speed: 0.3 Heading: 321.4 NavStatus: 0
[2024-06-13 13:04:09.785783+00:00] ShipId: 255806494 Latitude: 37.781621666666666 Longitude: -122.36749333333334 Speed: 1.2 Heading: 296.2 NavStatus: 0
[2024-06-13 13:04:10.393677+00:00] ShipId: 368992000 Latitude: 37.74805 Longitude: -122.38328166666666 Speed: 0 Heading: 0 NavStatus: 5
[2024-06-13 13:04:11.069113+00:00] ShipId: 366844270 Latitude: 37.79433166666667 Longitude: -122.28603666666666 Speed: 0.4 Heading: 13 NavStatus: 5
Ok, cool. The data is printed and probably already in the database. How can we make sure?
Easy peasy lemon squeezy.
We are going to use CURL again:
curl -u nacho:clickhouseFTW2024! 'http://localhost:8123/?query=SELECT%20*%20FROM%20vessels_tracking.ais_data%20LIMIT%2010%20FORMAT%20TabSeparatedWithNames'
As you can see, I'm limiting my query to 10 results. For testing, no need for more.
Now, if the data is pushing to ClickHouse, the result of the query should look like this:
ts	ship_id	latitude	longitude	speed	heading	nav_status
2024-06-13 13:03:59.876	368341690	37.79463	-122.31805	9.1	107.5	0
2024-06-13 13:04:01.503	368231420	37.512493	-122.19593	0	360	5
2024-06-13 13:04:02.522	366999711	37.810505	-122.36068	0	289	5
2024-06-13 13:04:02.995	701006099	-34.597263	-58.364887	0	85.4	3
2024-06-13 13:04:03.903	366844270	37.79431	-122.28604	0.6	354.9	5
2024-06-13 13:04:04.454	256037000	37.39175	-123.39798	2.1	226	0
2024-06-13 13:04:05.356	368173000	37.774014	-122.241714	0	251	5
2024-06-13 13:04:05.449	366963980	37.945312	-122.50869	0	293.5	0
2024-06-13 13:04:05.964	367153070	37.914932	-122.361885	0	289.3	5
2024-06-13 13:04:05.990	367145450	37.809856	-122.41158	0	34.1	15
Success!
Let's visualize it
Ok, ok, calm down. We have data, everything is running, now, let's visualize it using Grafana.
Let's go to http://localhost:3000, using the username admin and password admin. (If you changed this, use your credentials)
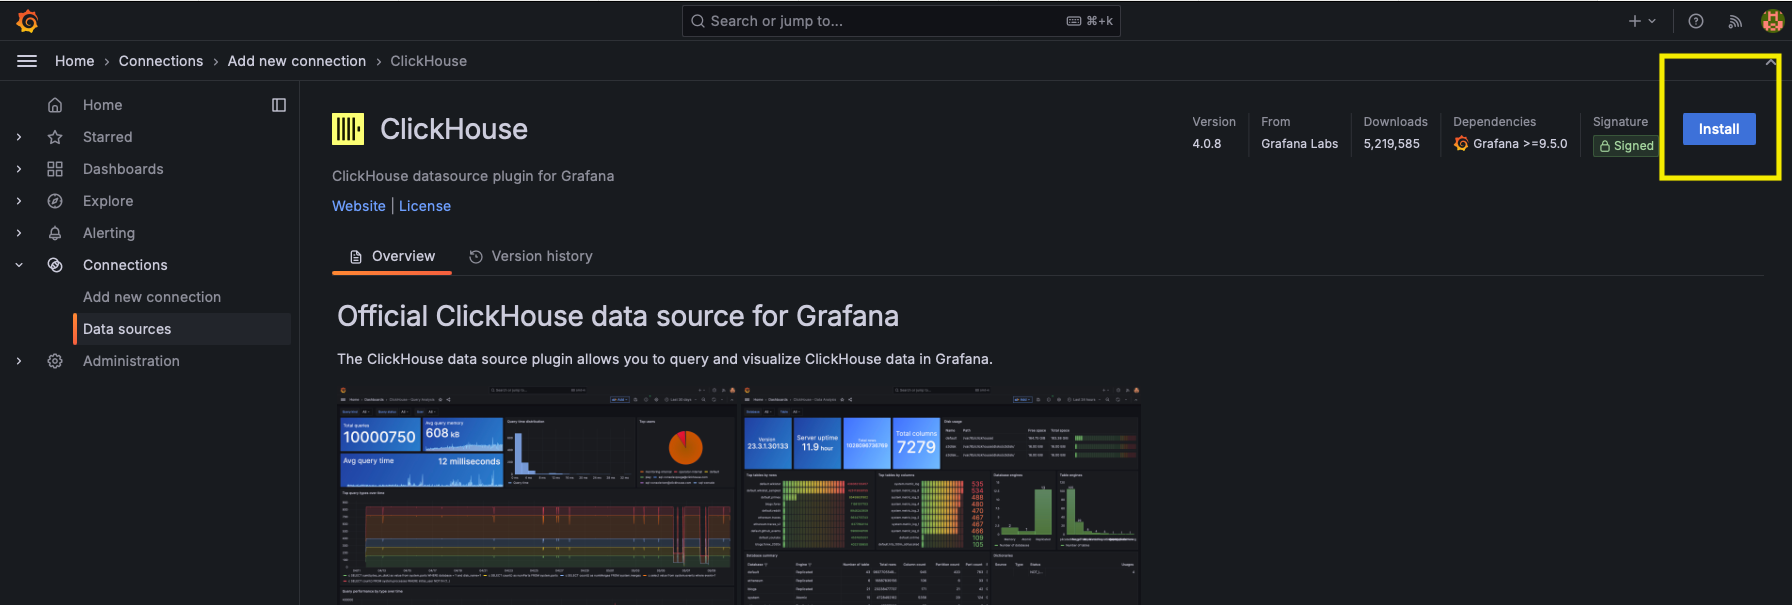
Go to connections, Add a new connection, and select ClickHouse.
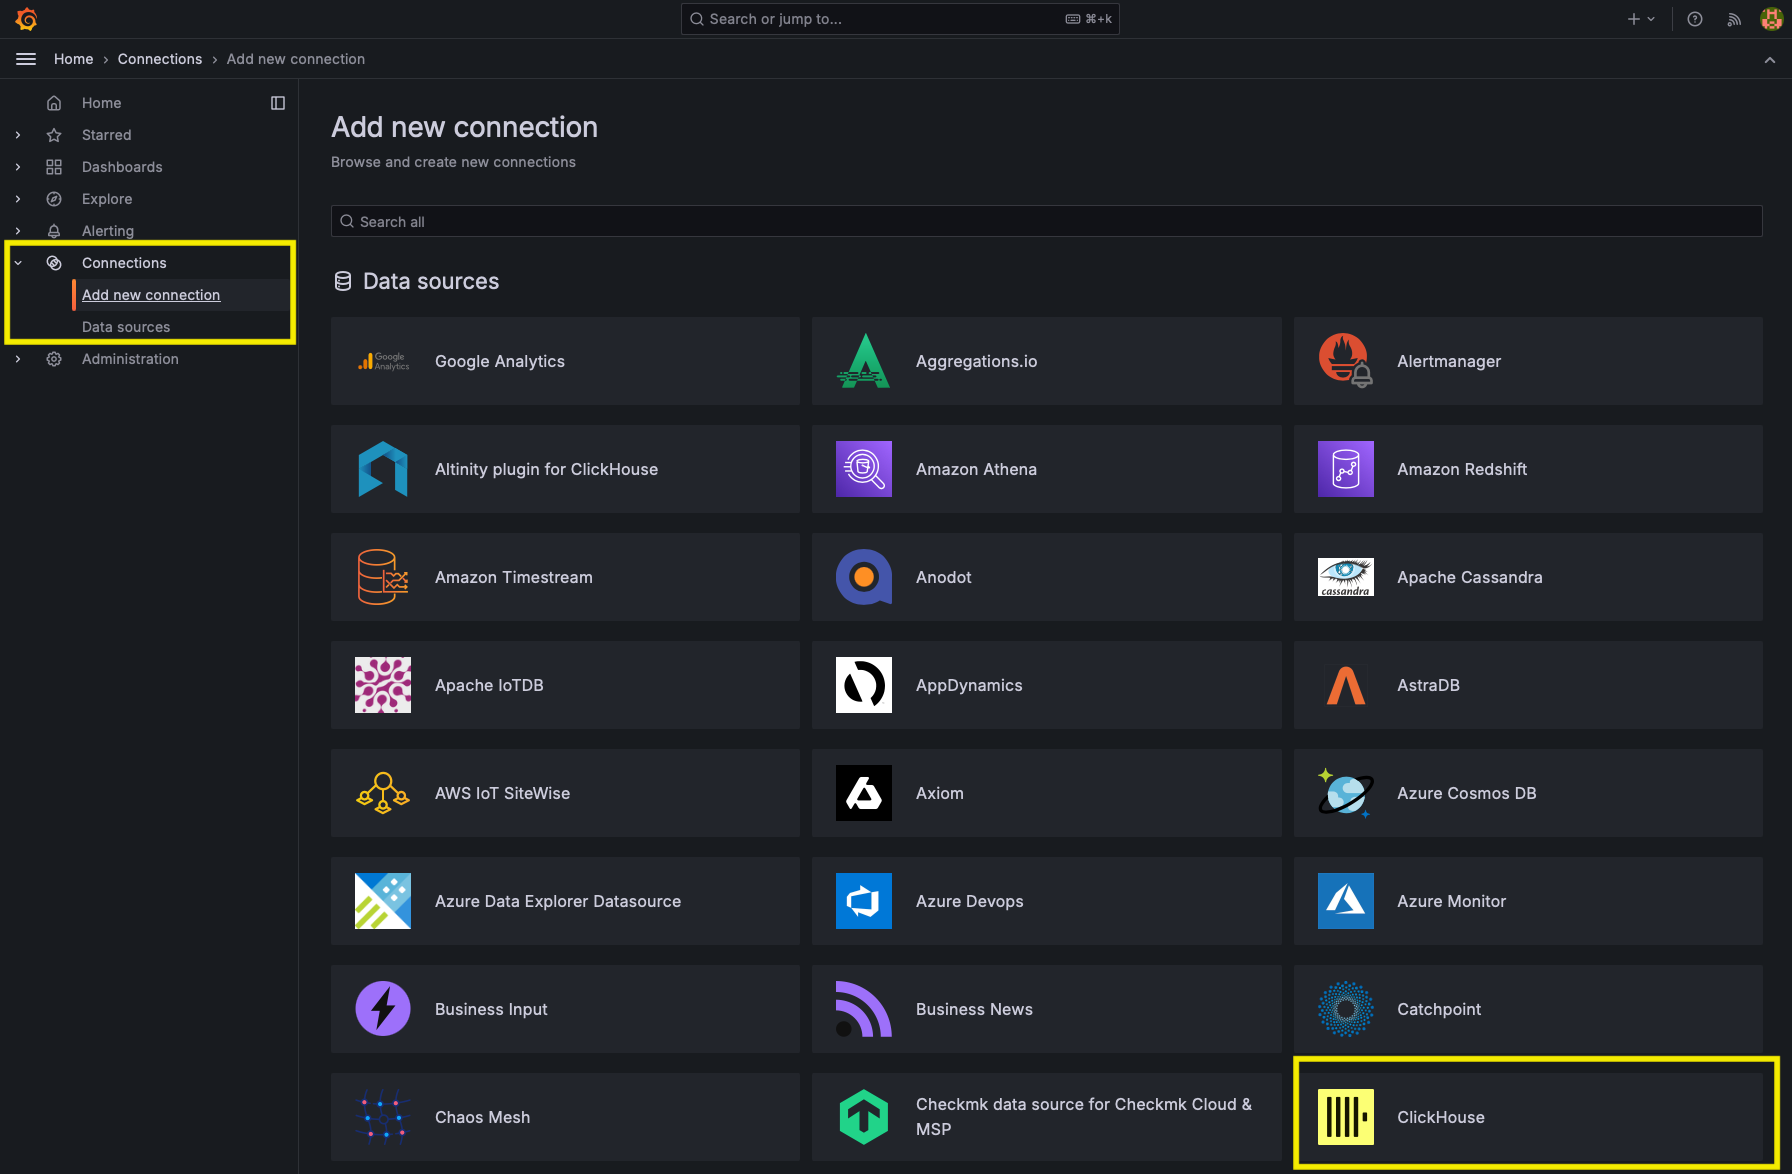
Click on Install
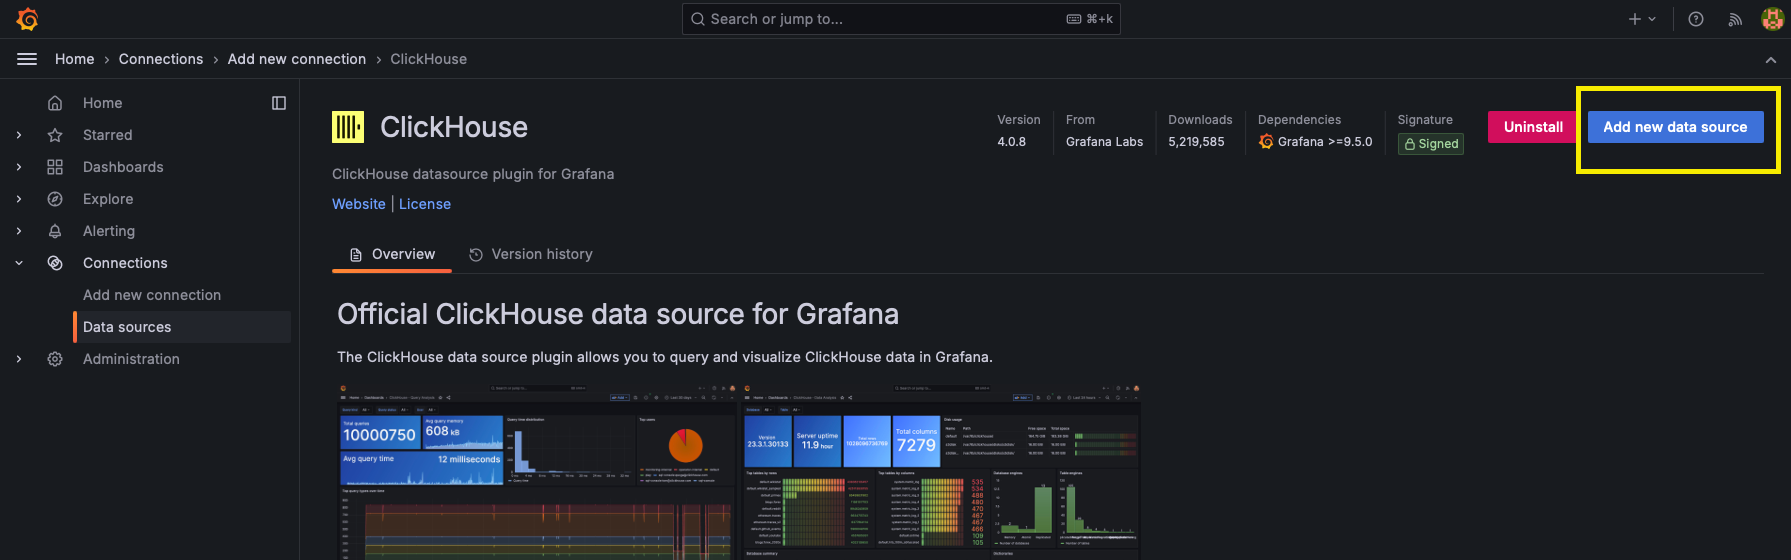
Then, click on Add new data source
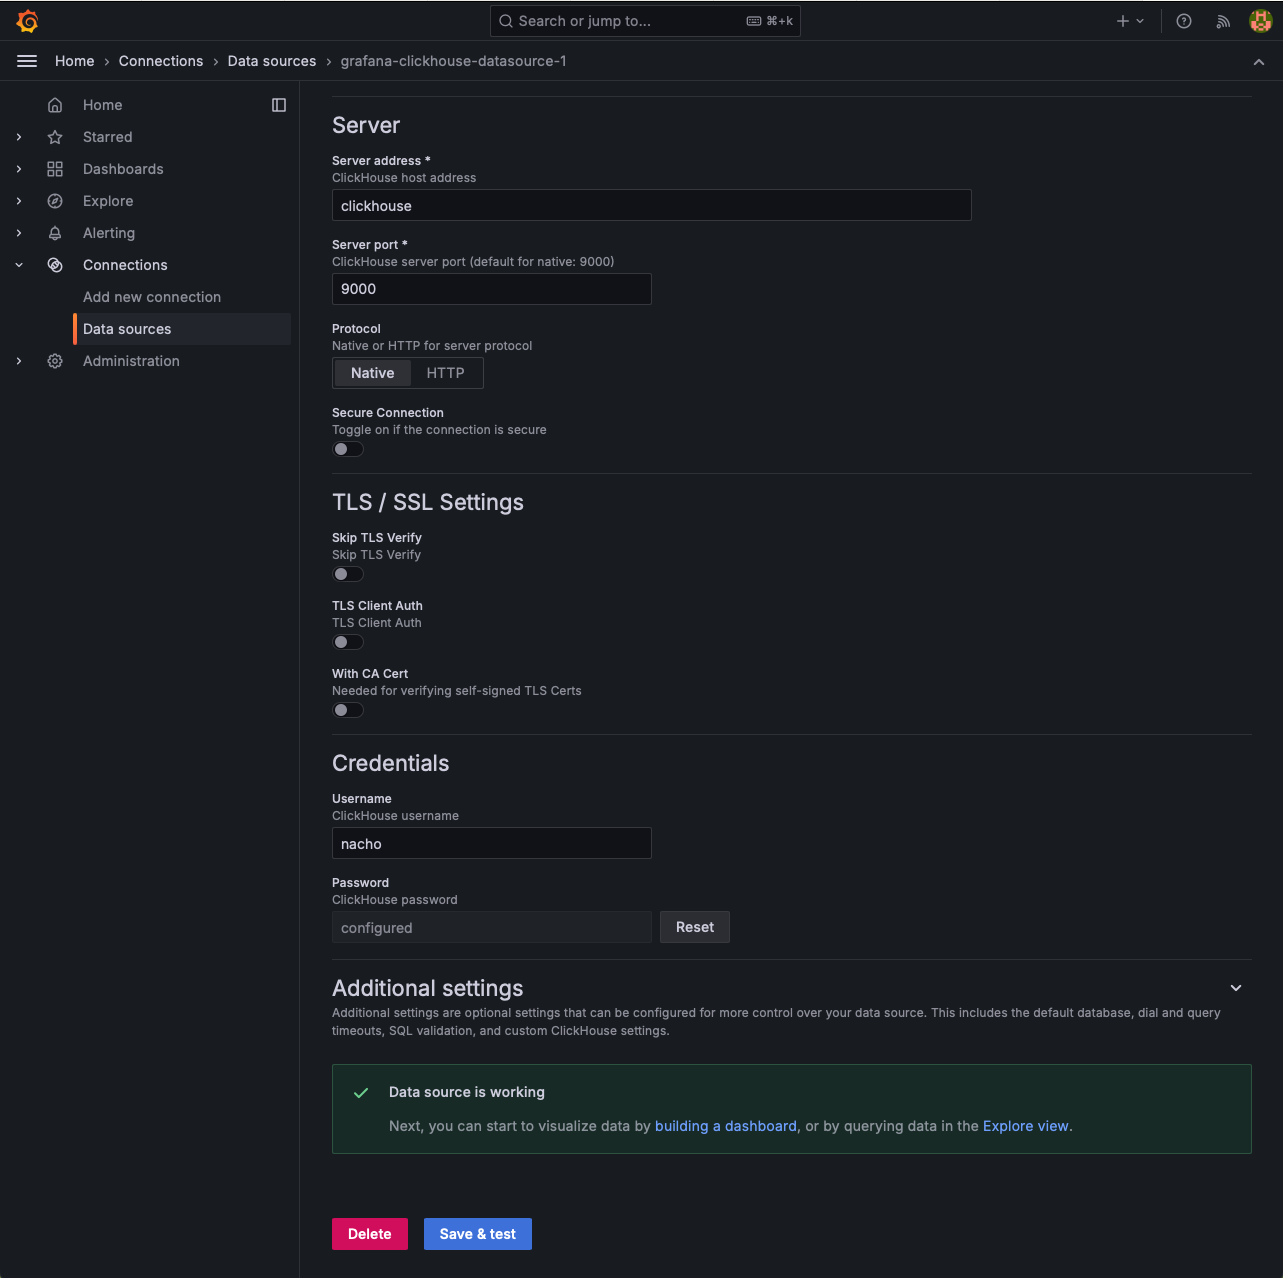
You will find this page where we need to fill in the connection info to ClickHouse. Here, let me give you a tip.
You might want to use localhost, but localhost refers to the Grafana container itself. We don't have ClickHouse running in the Grafana container, so we need to point to the ClickHouse container, which is named clickhouse. Don't include http:// or something like that.
You can connect using port 9000 and use native as the protocol, or http and use 8123 as the server port.
If everything goes as expected, as soon as you click Save & Test, you should see the banner that says "Data source is working".
Now, the good stuff.
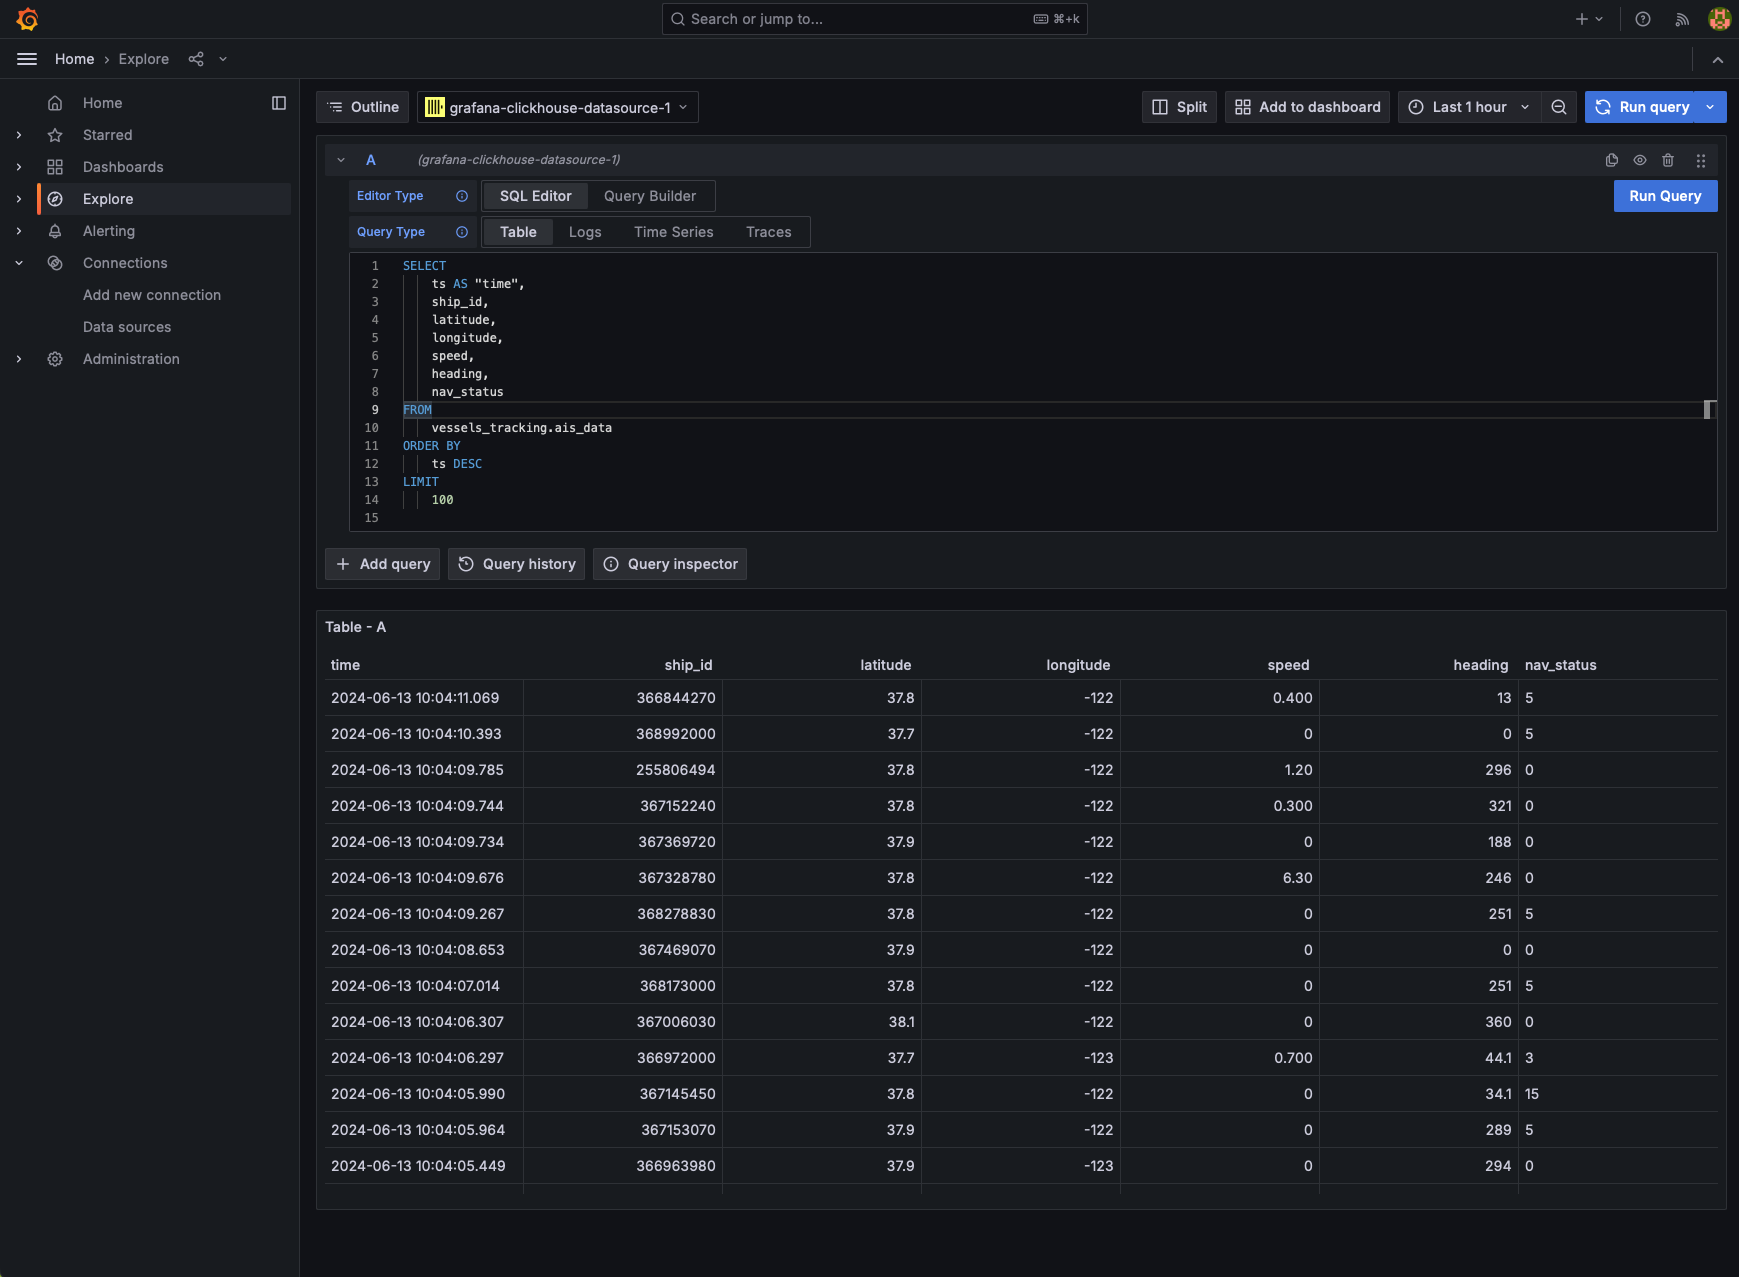
Click on "Explore View" on that page and use this query:
SELECT
    ts AS "time",
    ship_id,
    latitude,
    longitude,
    speed,
    heading,
    nav_status
FROM
    vessels_tracking.ais_data
ORDER BY
    ts DESC
LIMIT
    100
You will see something like this...
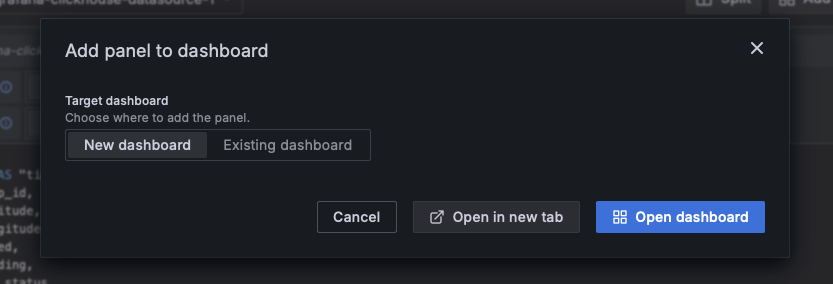
Now, click on the Add to dashboard button at the top right...
Click on "Open Dashboard"
And you will see this
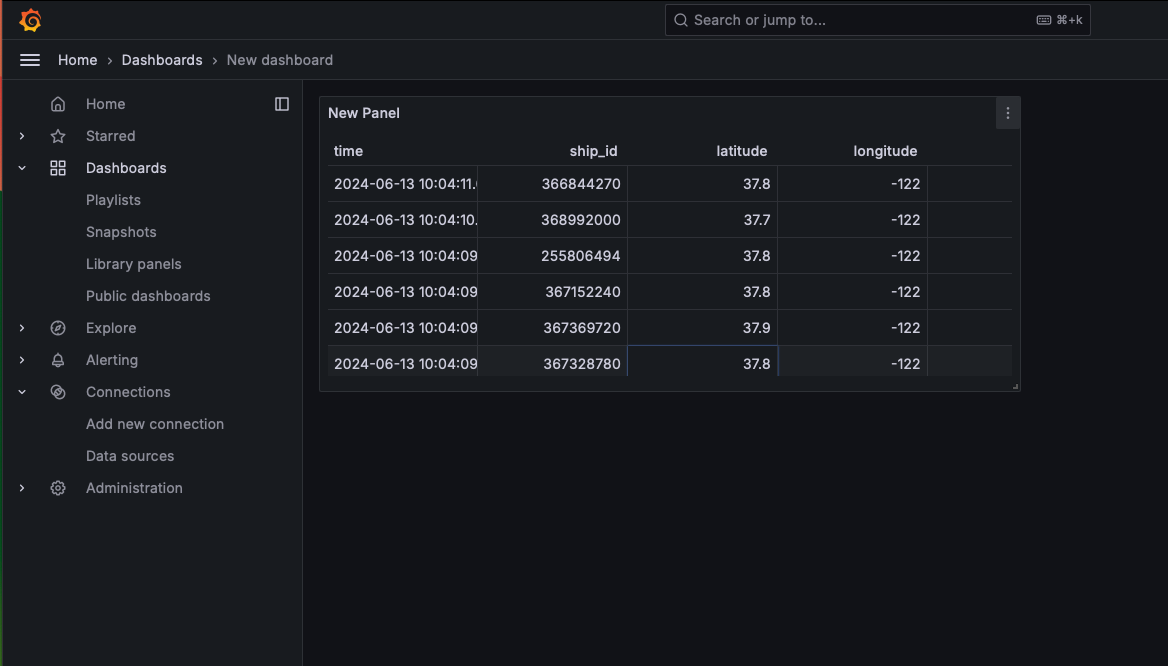
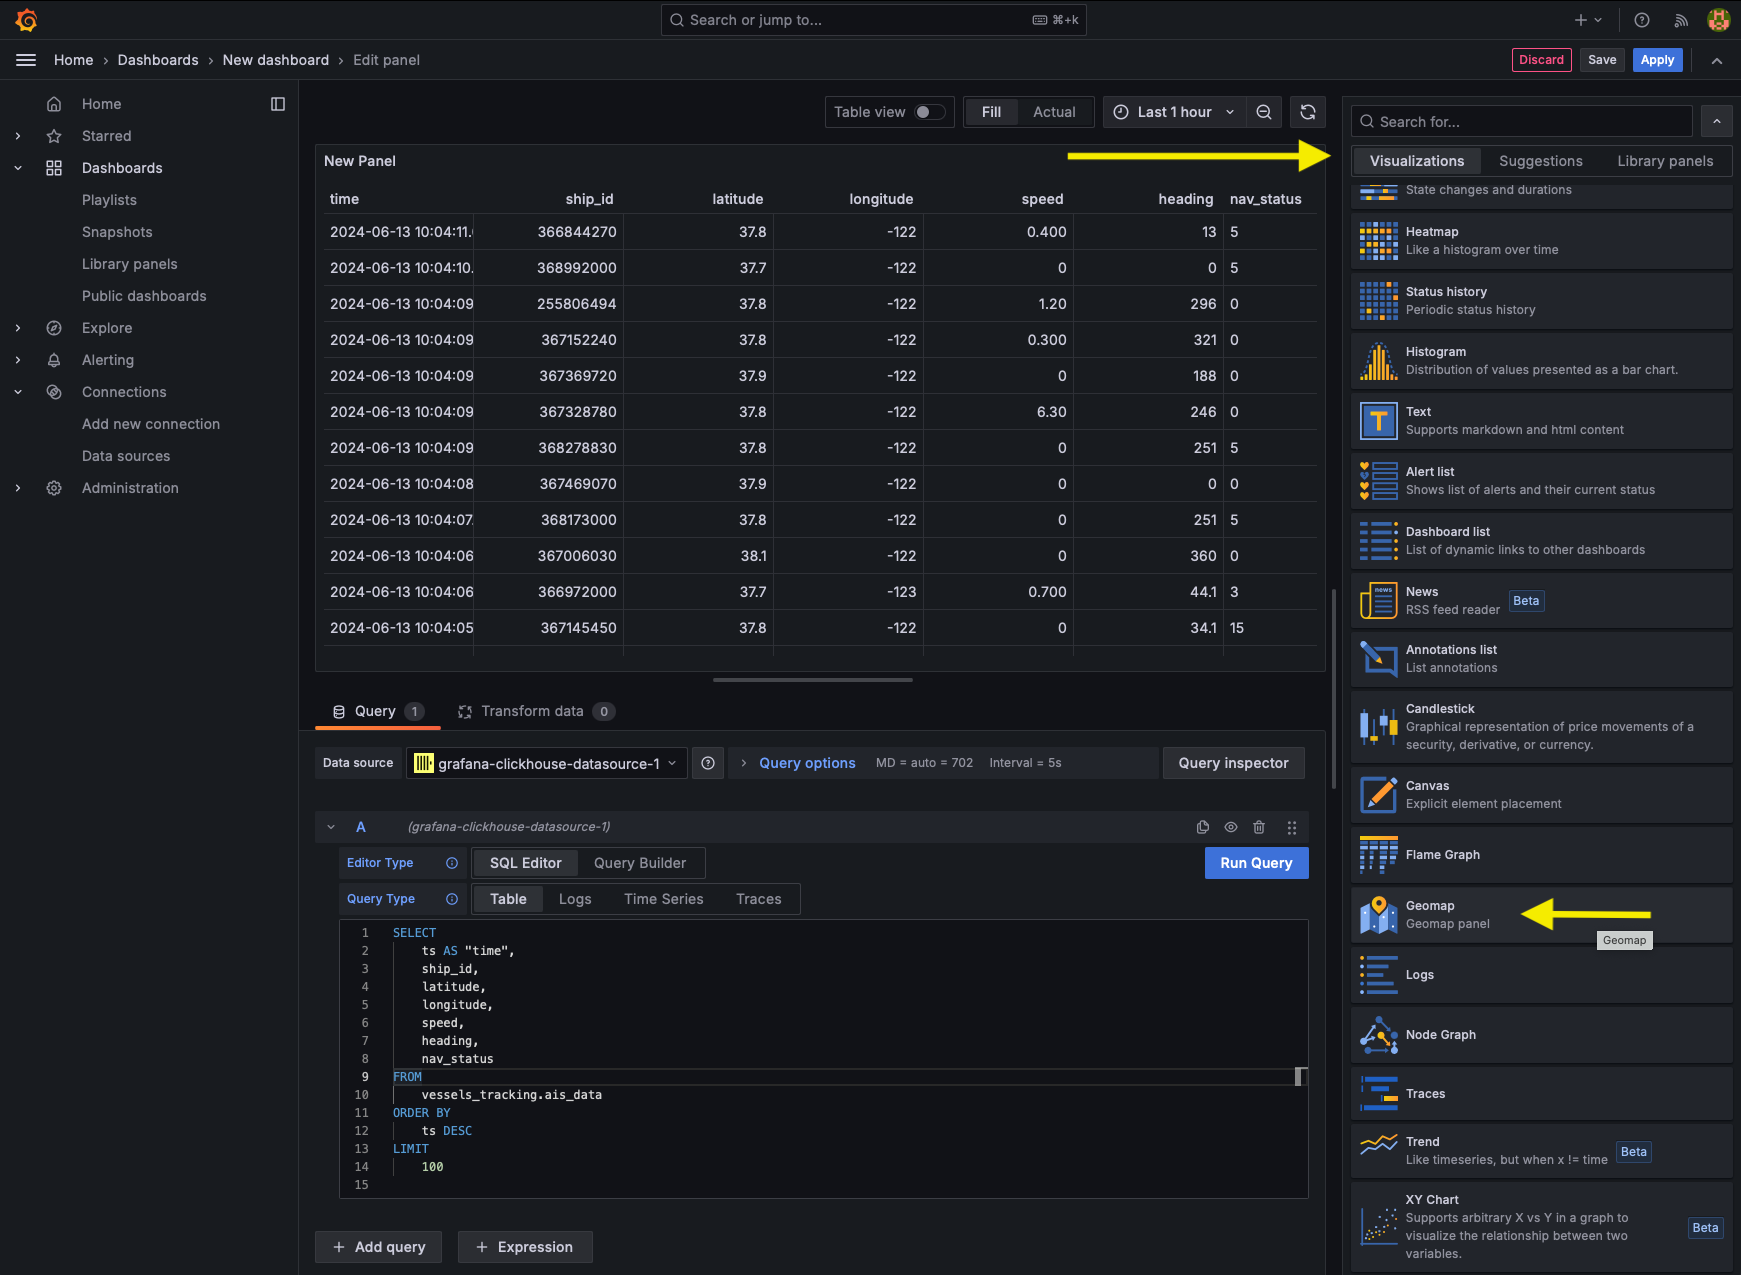
Let's make it more appealing. Edit that panel, go to visualizations, and select Geomap.
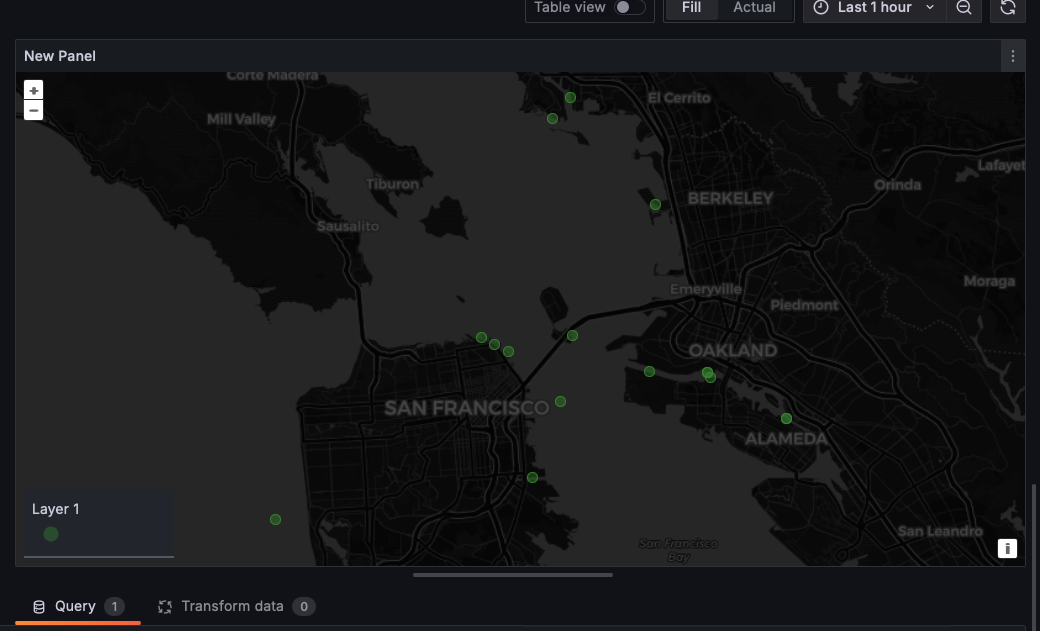
It is going to look like this, and as you can see, we have points on the map, specifically in Buenos Aires and San Francisco.
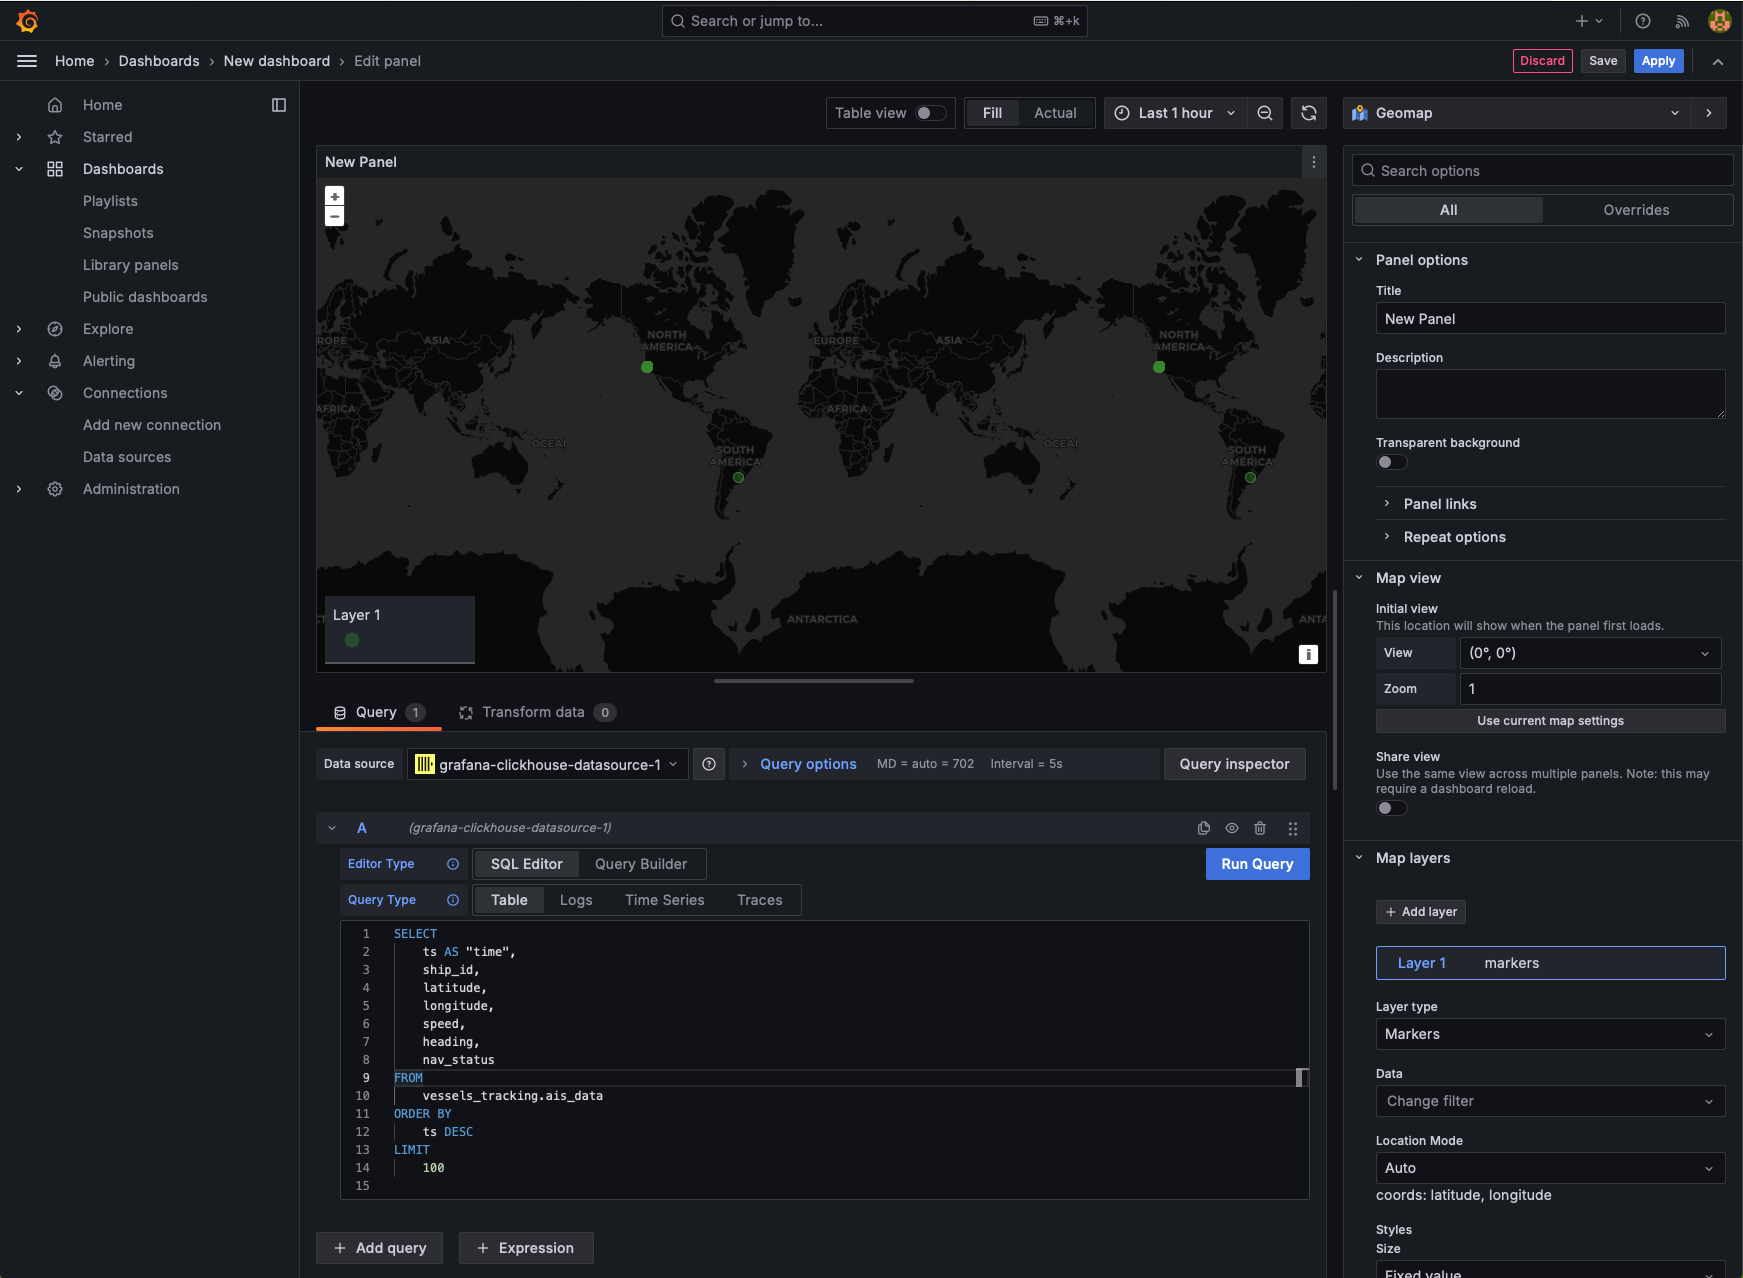
Let's zoom in to San Francisco:
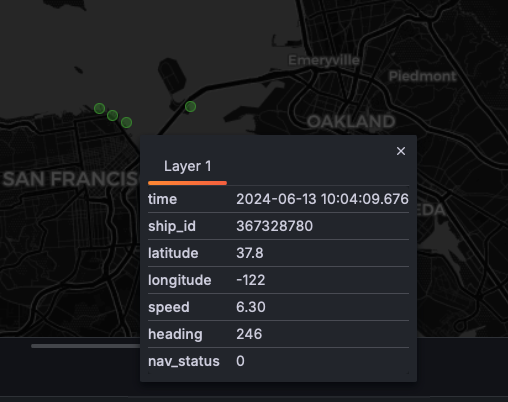
Awesome, we have vessels, and if you click on one of the green dots, you can see the data from that ship:
To conclude
What a fun project. In this article, you learned how to track vessels using the AisStream API, how to get that data using Websockets in Python, how to deploy ClickHouse and Grafana in Docker, and how to ingest and visualize data.
Have you tried it? Let me know on Twitter or LinkedIn about your results.