Long Time No See Redis. Exploring RedisTimeSeries
In this post, I explore Redis as a time series database using Docker, Python, and RedisInsight. From monitoring my Mac in real time to querying time series data with blazing speed, this hands-on guide walks through the unexpected power of Redis Stack for time series workloads.


Ok, here’s the thing.
For the last six years, I’ve been working with time series data, mainly with InfluxDB, including a stint at InfluxData itself. But I’ve also experimented with other databases like Timescale, QuestDB, and ClickHouse, applying them across use cases from system monitoring and truck tracking to connecting medical devices.
But at this point, I honestly didn’t remember Redis ever coming up as a time series database. For me, Redis was just a cache, something I used back in the day to boost the performance of a Magento site. Nothing more.
So when I stumbled across RedisTimeSeries, I was like: Wait, what?
That sparked my curiosity, and I thought: I need to try this out.
What I ended up exploring completely blew my mind in terms of possibilities.
What the heck is Redis Stack
A bit of background first.
Redis Stack is essentially the modern, modular backbone of Redis. It not only supports time series workloads, but also brings in powerful features through modules like:
- 🧪 RedisTimeSeries
- 🔍 RediSearch
- 📦 RedisJSON
- 🧠 RedisGraph
- 🎯 RedisBloom
These modules can be plugged into the Redis we all know and love, turning it into an extensible, multi-model data platform.
Launched in 2022, Redis Stack somehow slipped under my radar. I hadn’t even heard of it until recently, when I started diving into the latest and greatest from Redis.
Exploring RedisTimeSeries
So, to really start exploring (beyond just learning how to deploy RedisTimeSeries) I like to choose a use case. And the simplest of all use cases is system monitoring.
As you might know by now, I’m someone who learns by doing: trying, breaking, and trying again. So, let’s jump in.
The first step was deploying Redis Stack along with RedisInsight. The quickest way to do this is using containers. In my case, I use Rancher Desktop, which lets me run Docker commands and makes my life easier.
Lets do it.
services:
  redis:
    image: redis/redis-stack-server:latest
    container_name: redis
    ports:
      - "6379:6379"
    volumes:
      - redis_data:/data
    restart: unless-stopped

  redisinsight:
    image: redis/redisinsight:latest
    container_name: redisinsight
    ports:
      - "5540:5540"
    restart: unless-stopped

volumes:
  redis_data:
Basically, we’re deploying Redis Stack Server, persisting the data, and, as I mentioned before, using RedisInsight to get a nice graphical interface to interact with Redis.
Once you save that as docker-compose.yml, run:
docker compose up -dthen, run:
docker psAnd you should see something like this:
CONTAINER ID   IMAGE                        COMMAND                  CREATED         STATUS         PORTS                                                 NAMES
448a2de5e946   redis/redisinsight:latest         "./docker-entry.sh n…"   3 hours ago   Up 3 hours   0.0.0.0:5540->5540/tcp, :::5540->5540/tcp   redisinsight
9bdf5a734378   redis/redis-stack-server:latest   "/entrypoint.sh"         3 hours ago   Up 3 hours   0.0.0.0:6379->6379/tcp, :::6379->6379/tcp   redis
Now it’s time to open RedisInsight and connect to our Redis server so we can start interacting through the UI.
Head to: http://127.0.0.1:5540
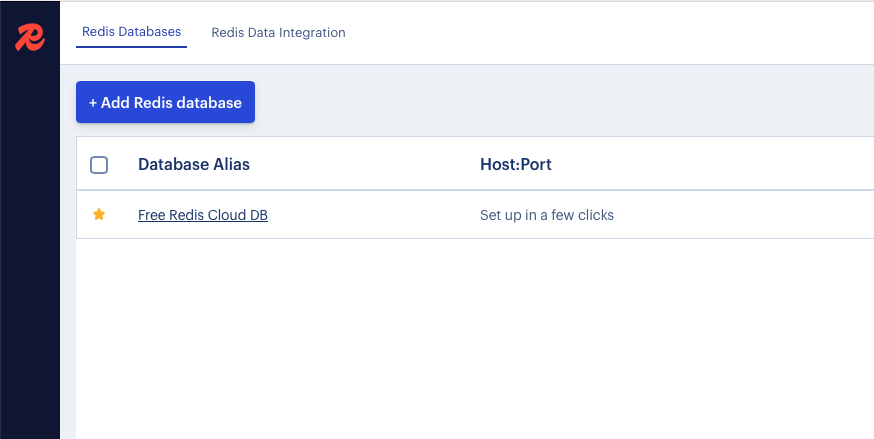
Click on “Add Redis Database”.
When prompted, enter your computer’s name or local IP address, don’t use localhost. Why? Because RedisInsight runs in a container, and localhost from inside that container refers to itself, not your actual Redis server.
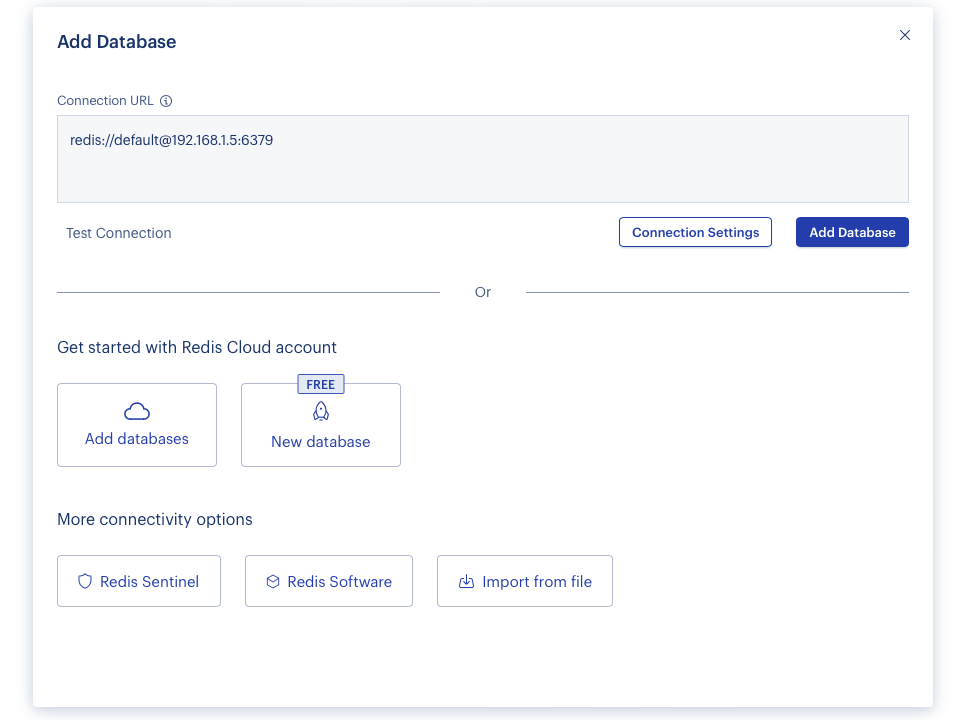
Click “Add Database”, and once it connects, you should see something like this:
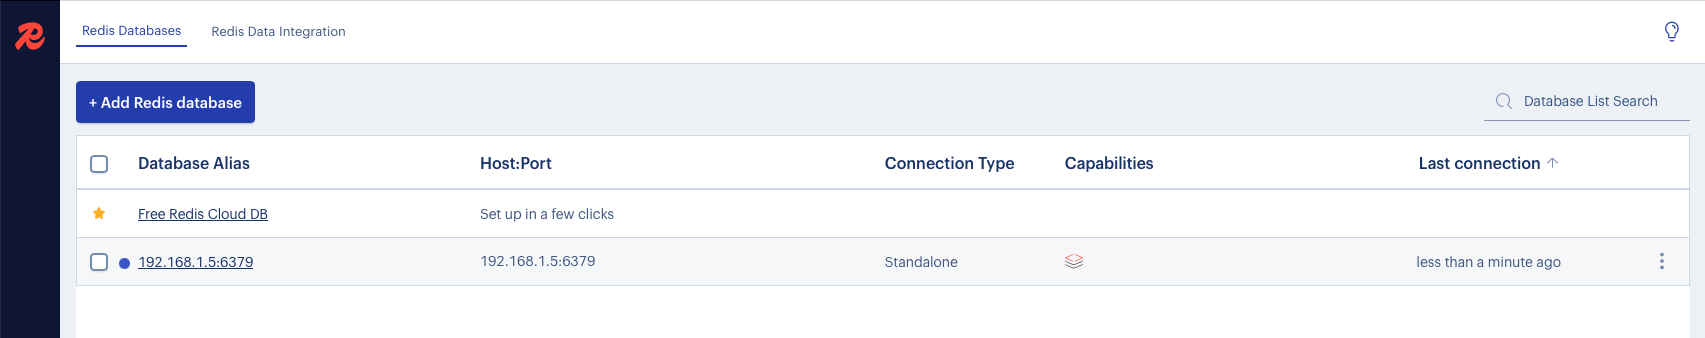
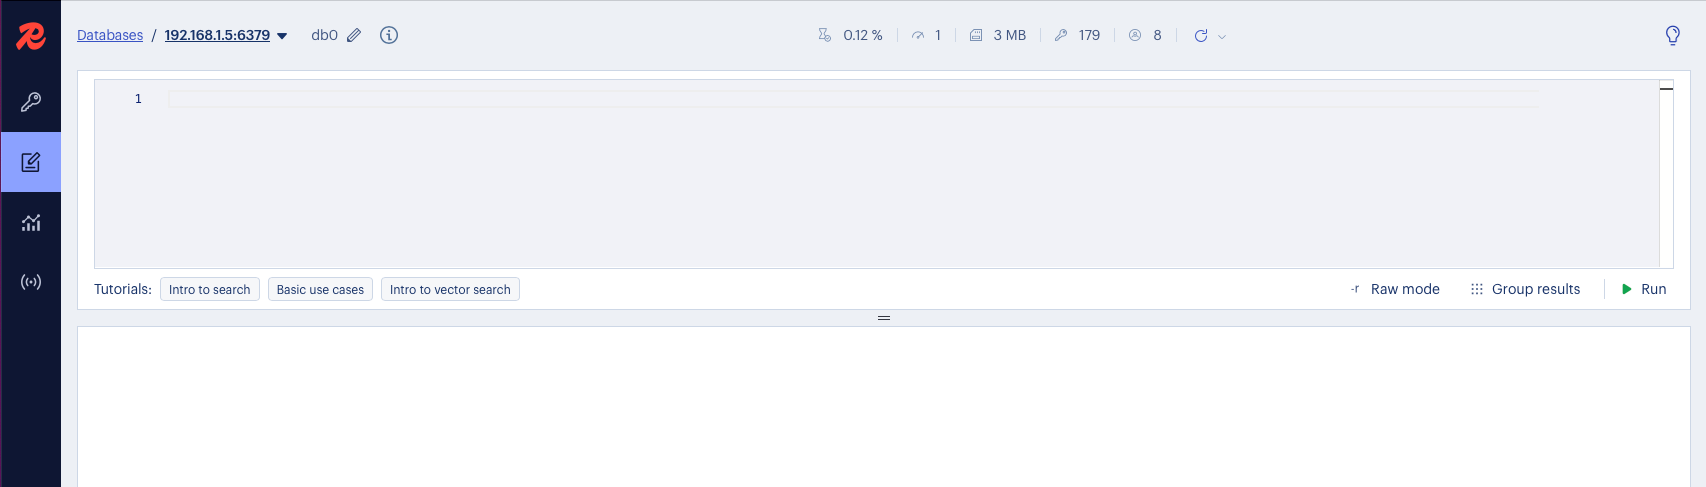
Now, click on your Redis server name and open the Workbench tab.
This is where we’ll run queries. But first, we need to push some data to Redis.
The fun part: Ingesting Data
Now, as I mentioned, the simplest use case for me is system monitoring, and the most relaxed version of that is monitoring my own computer.
To do this, I wrote a quick Python script using the psutil package to pull data from my macOS device.
If you want to follow along, install the required packages:
pip3 install psutils redisWhat we’re doing here is installing the psutil and redis client packages via pip.
import time
import psutil
import redis

# Connect to Redis
r = redis.Redis(host="localhost", port=6379)

# Create the time series keys if they don't exist
def setup_keys():
    keys = {
        "system:cpu": "cpu",
        "system:memory": "memory",
        "system:disk": "disk"
    }

    for key, label in keys.items():
        try:
            r.execute_command("TS.CREATE", key, "RETENTION", 86400000, "LABELS", "type", label)
        except redis.ResponseError as e:
            if "already exists" not in str(e):
                raise

# Collect and push metrics every N seconds
def collect_metrics(interval=5):
    setup_keys()
    while True:
        cpu = psutil.cpu_percent()
        mem = psutil.virtual_memory().percent
        disk = psutil.disk_usage("/").percent

        now = int(time.time() * 1000)  # milliseconds

        r.execute_command("TS.ADD", "system:cpu", now, cpu)
        r.execute_command("TS.ADD", "system:memory", now, mem)
        r.execute_command("TS.ADD", "system:disk", now, disk)

        print(f"[{time.ctime()}] CPU: {cpu}% | Mem: {mem}% | Disk: {disk}%")
        time.sleep(interval)

if __name__ == "__main__":
    collect_metrics()
As you can see, it’s quite simple. We’re creating time series keys in the database. In case you’re new to Redis, it’s a key-value database, which is why this format makes perfect sense.
In this script, I’m collecting CPU, memory, and disk usage, and I saved it as collector.py.
Now let’s run it:
Python 3 collector.pyIf everything is working correctly, you should start seeing output like this:
[Tue May 20 12:40:44 2025] CPU: 10.6% | Mem: 69.6% | Disk: 1.9%
[Tue May 20 12:40:49 2025] CPU: 13.3% | Mem: 69.7% | Disk: 1.9%
[Tue May 20 12:40:54 2025] CPU: 15.8% | Mem: 69.1% | Disk: 1.9%
[Tue May 20 12:40:59 2025] CPU: 15.4% | Mem: 70.0% | Disk: 1.9%
[Tue May 20 12:41:04 2025] CPU: 14.2% | Mem: 70.1% | Disk: 1.9%
[Tue May 20 12:41:09 2025] CPU: 14.0% | Mem: 70.3% | Disk: 1.9%
[Tue May 20 12:41:14 2025] CPU: 13.9% | Mem: 70.2% | Disk: 1.9%
[Tue May 20 12:41:19 2025] CPU: 14.1% | Mem: 70.4% | Disk: 1.9%
[Tue May 20 12:41:24 2025] CPU: 15.2% | Mem: 69.8% | Disk: 1.9%
[Tue May 20 12:41:29 2025] CPU: 13.7% | Mem: 69.5% | Disk: 1.9%
[Tue May 20 12:41:34 2025] CPU: 12.7% | Mem: 69.3% | Disk: 1.9%
[Tue May 20 12:41:39 2025] CPU: 9.6% | Mem: 69.3% | Disk: 1.9%
[Tue May 20 12:41:44 2025] CPU: 10.1% | Mem: 69.0% | Disk: 1.9%
So yeah, that looks like a success!
Let’s go back to RedisInsight and see what we’ve got.
Querying the Data in RedisInsight
Let’s go back to RedisInsight and see what we’ve got.
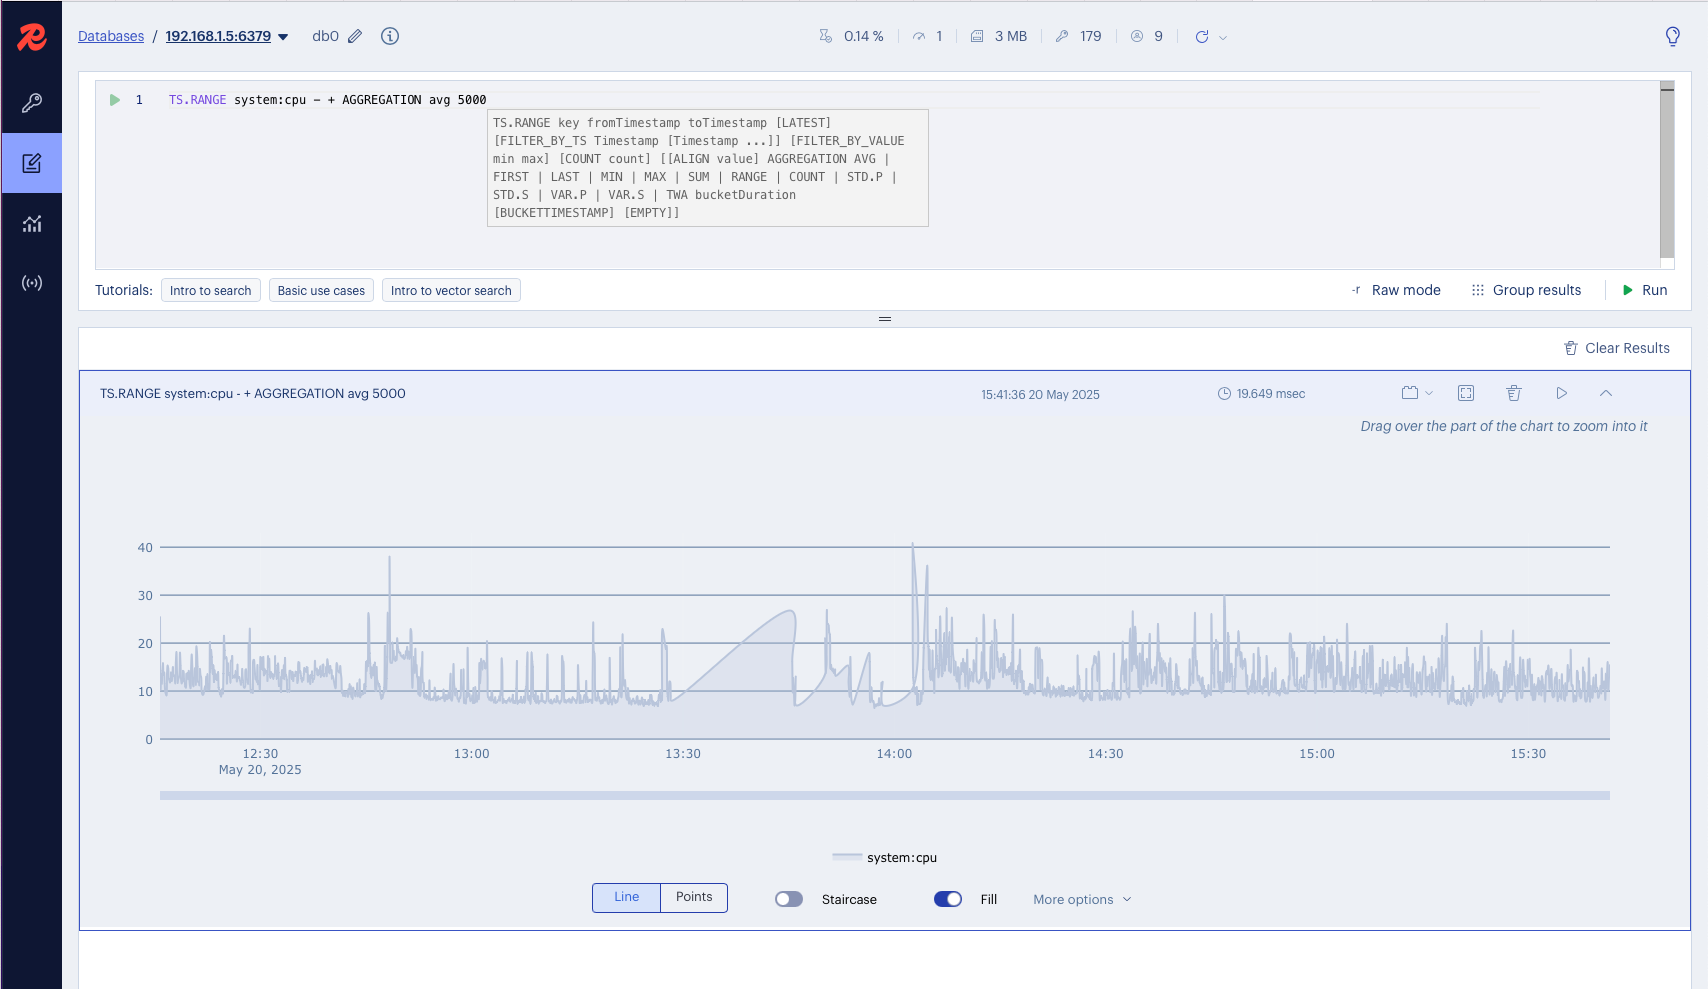
In the Workbench, run the following query:
TS.RANGE system:cpu - + AGGREGATION avg 5000This means we’re fetching the full range of data for system:cpu, aggregated by average values every 5000 milliseconds (5 seconds), and boom 💥, just like that, you’re graphing system metrics with Redis!
To Conclude
I’m genuinely excited about what I’ve seen so far. RedisTimeSeries may not have the full range of features you’d find in something like InfluxDB, but Redis brings its own strengths, blazing speed, simplicity, and the flexibility of the broader Redis Stack.
This feels like just the beginning for me. I’ll definitely keep exploring what else I can build with RedisTimeSeries, and who knows what creative use cases might pop up next?
Redis as a time series database? Maybe not the obvious choice, but definitely a fun and capable one. So stay tuned for more adventures in the realm of time series data (and Redis).
Bonus Track: Resources to Keep Exploring
Want to go deeper? Here are a few resources to continue your RedisTimeSeries journey:
- Telegraf Output Plugin: If you’re coming from InfluxDB or looking for something familiar, you can collect system metrics using Telegraf, and push them to RedisTimeSeries. (I haven’t tested this yet, but it’s on my list!)
- RedisTimeSeries Page:
- RedisTimeSeries in Github:

- Documentation Page:

What’s Next?
If you found this interesting, I’d love to hear from you:
- Are you already using Redis for something unexpected?
- Have you tried RedisTimeSeries in production?
- Want me to explore Redis + Grafana, alerts, or time series pipelines?
Drop a comment, share this post, or connect with me on LinkedIn. Let’s keep learning and experimenting, Redis has way more up its sleeve than just caching.